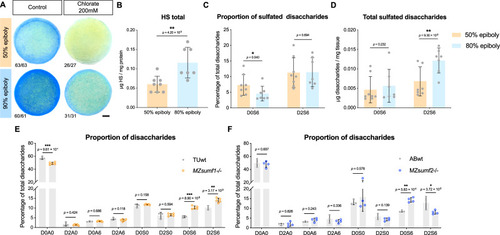
Heparan sulfate sulfation patterns change during gastrulation and are regulated by sumf1/sumf2.
A Representative images of AB WT zebrafish early (50% epiboly, 5.3 hpf) and late (90% epiboly, 9 hpf) gastrulae stained with Alcian Blue for sulfated GAGs. Alcian Blue staining was diminished in zebrafish embryos treated at dome stage (4.3 hpf) with 200 mM sodium chlorate. Fractions indicate the number of embryos with the depicted staining pattern over number of embryos examined. Scale bar 100 μm. B–D HILIC-Q-TOF-MS analysis of early and late AB WT zebrafish gastrulae showing the total amount of heparan sulfate (HS) (B), the percentage of D0S6 and D2S6 HS disaccharides (C), and the total amount of D0S6 and D2S6 disaccharides (D) at the stages indicated. E, F HILIC-Q-TOF-MS analysis of late zebrafish gastrulae (80% epiboly, 8.5hpf) showing the percentage of each HS disaccharide in MZsumf1-/- versus TU WT (E) and in MZsumf2-/- versus AB WT (F) genetic backgrounds. Plots show mean and standard deviation, with each dot representing an independent clutch of 100 embryos, **** p < 0.0001, *** p < 0.001, ** p < 0.01, * p < 0.05, two-sided Mann-Whitney test. Source data are provided as a Source Data file.
|
