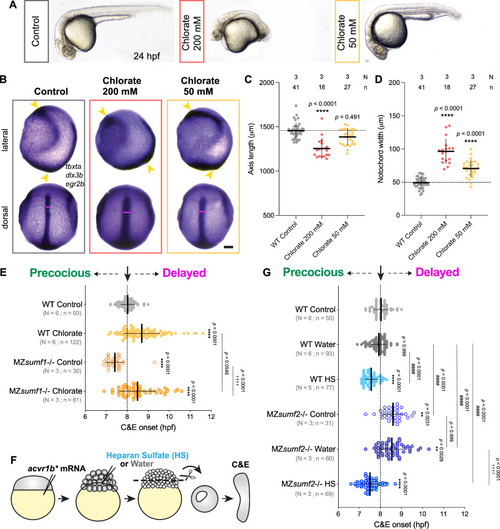
HSPGs mediate the effect of sulfatase modifying factors on C&E timing.
A Representative images of 24 hpf zebrafish embryos treated at dome stage (4.33 hpf) with 200 mM or 50 mM of sodium chlorate. B Representative images of WISH for tbxta (notochord), dlx3b (neural border) and egr2b (rhombomeres 3 & 5) in tailbud stage (10 hpf) control and sodium chlorate treated embryos shown from lateral (top) and dorsal (bottom) views. Scale bar 100 μm. C, D AP axis length (C) and notochord width (D) (as in Fig. 2) of embryos depicted in (B). Each dot represents a single embryo. Means and standard deviation are indicated. **** p < 0.0001 compared with WT control embryos by Kruskal–Wallis and Dunn’s multiple comparisons tests. E Onset of extension in acvr1b* explants of the indicated conditions. Dotted line shows typical extension onset of WT control explants around 8 hpf. Each dot represents a single explant. Means and standard deviation are indicated. N number of independent experiments, n number of embryos. ****/ ††††p < 0.0001 compared with WT and MZsumf1-/- control groups, respectively, by Kruskal–Wallis and Dunn’s multiple comparisons tests. F Diagram of extracellular heparan sulfate (HS) or water (control) injections in 256-cell embryos prior to explantation (modified from36). G Explant extension onset as in (E). ** p > 0.01; ****/ ####/ ††††p < 0.0001 compared with WT, WT + water, and MZsumf2-/- + water groups, respectively, by Kruskal–Wallis and Dunn’s multiple comparisons tests. All explants and embryos are of the AB background. Source data are provided as a Source Data file.
|
