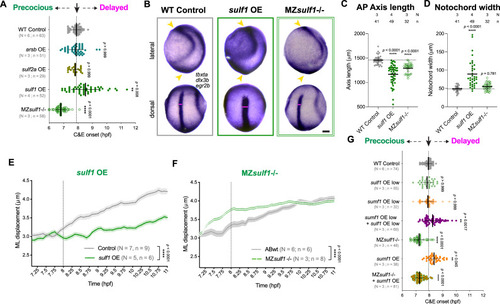
The extracellular sulfatase Sulf1 governs C&E and its timing.
A Onset of extension in acvr1b* zebrafish explants of the indicated conditions. Dotted line shows typical extension onset of WT control explants around 8 hpf. Each dot represents a single explant. Means and standard deviation are indicated, N: number of independent experiments, n: number of explants. *** p < 0.001, **** p < 0.0001 compared with WT control group by Kruskal–Wallis and Dunn’s multiple comparisons tests. See Supplementary Movie 3. B Representative images of WISH for tbxta (notochord), dlx3b (neural plate border) and egr2b (rhombomeres 3 & 5) in tailbud stage (10 hpf) zebrafish embryos of the indicated conditions. Anterior is up in all images, lateral views are on top, dorsal views on bottom. Scale bar 100 μm. (C, D) Anteroposterior (AP) axis length (C) and notochord width (D) were quantified as in Fig. 2 from embryos depicted in (B). Each dot represents a single embryo. Means and standard deviation are indicated. **** p < 0.0001 compared with WT control group by Kruskal–Wallis and Dunn’s multiple comparisons tests. E, F ML cell displacement from automated nuclear tracking (as in Fig. 3) in WT control, sulf1 OE (E) and MZsulf1-/- (F) zebrafish gastrulae. Means and standard error are indicated. N number of independent experiments, n number of embryos. **** p < 0.0001 compared with WT control group by two-sided Wilcoxon signed-rank test. G Onset of extension in acvr1b* explants of the indicated conditions. Dotted line shows typical extension onset of WT control explants around 8 hpf. Each dot represents a single explant. All explants and embryos are of the AB background. Means and standard deviation are indicated, N number of independent experiments, n number of explants. ** p < 0.01, **** p < 0.0001 compared with WT control group by Kruskal–Wallis and Dunn’s multiple comparisons tests. See Supplementary Movie 4. Source data are provided as a Source Data file.
|
