
- Title
-
Manic Fringe promotes endothelial-to-mesenchymal transition mediated by the Notch signalling pathway during heart valve development
- Authors
- Yang, J., Wang, Z., Zhou, Y., Jiang, S., Qin, X., Xu, Z., Wang, Y., Zuo, M., Meng, Z., Chen, S., Wang, Q., Wang, J., Sun, K.
- Source
- Full text @ J. Mol. Med.
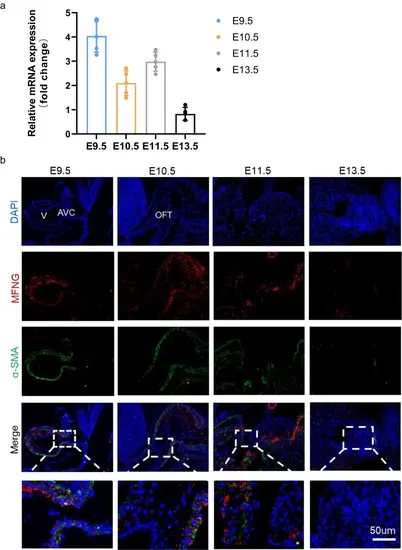
Expression of MFNG in mice during embryonic heart development. a qRT-PCR analysis of MFNG mRNA levels during the embryonic heart development of mice. GAPDH served as an internal reference. b Immunofluorescence staining revealed the endogenous distribution of MFNG at E9.5–E11.5 and E13.5 in mouse embryos. Scale bars = 50 µm. All data presented here were obtained from five independently repeated biological experiments |
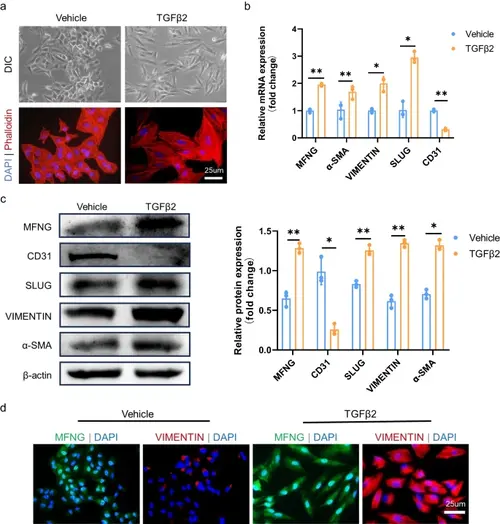
Upregulation of MFNG in TGFβ2-induced EndMT. a The transition of HUVECs from their typical cobblestone-like shape to spindle-like cells with protrusions after 48 h of exposure to 10 ng/ml TGFβ2 was visualized under a light microscope (upper). F-actin staining with phalloidin revealed elongated HUVECs with protrusions. Scale bars = 25 µm. b qRT-PCR analysis was used to estimate the relative mRNA levels of MFNG, α-SMA, VIMENTIN, SLUG, and CD31 in HUVECs. GAPDH was employed as a loading control. c Western blot displayed the alterations in protein levels of EndMT-specific markers and MFNG following a 48-h treatment with 10 ng/ml TGFβ2. β-actin was used as a loading control. The band density of MFNG, CD31, SLUG, VIMENTIN, and α-SMA on the Western blot was quantified using ImageJ software. d Cellular immunofluorescence demonstrated a significant upregulation of MFNG expression in HUVECs after TGFβ2 treatment. Scale bars = 25 µm. All data reported here were obtained from three independently repeated biological experiments |
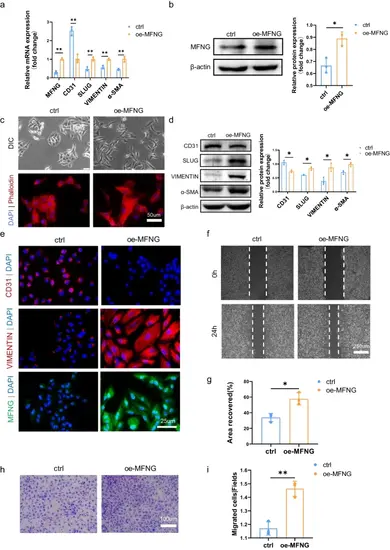
Induction of EndMT by MFNG overexpression in HUVECs. a qRT-PCR analysis was conducted to determine the relative mRNA levels of MFNG, with GAPDH as the loading control. b Western blot confirmed MFNG overexpression in HUVECs, with β-actin as the loading control. The band density of MFNG was quantified. c Light microscopy (upper) illustrated the morphological changes in HUVECs after MFNG overexpression. F-actin staining with phalloidin using a fluorescence microscope (lower) revealed the transformation of HUVECs into mesenchymal stellate cells with long protrusions and filopodia 48 h post-transfection. Scale bars = 25 µm. d Western blot depicted alterations in EndMT-related markers in HUVECs with MFNG overexpression compared to the control group, with a quantitative analysis of the relative protein expressions of MFNG, CD31, SLUG, VIMENTIN, and α-SMA using ImageJ software. e Cellular immunofluorescence staining for CD31 (red), VIMENTIN (red), and MFNG (green). Nuclei were counterstained with DAPI. Scale bars = 25 µm. f, g Representative images of cell wound healing assays and quantification of the scratch repair rate. Scale bars = 250 µm. h, i Assessment of the migratory ability of HUVECs overexpressing MFNG via the transwell assay and quantification of migrated HUVECs. Scale bars = 100 µm. All data presented are from three independently repeated biological experiments |
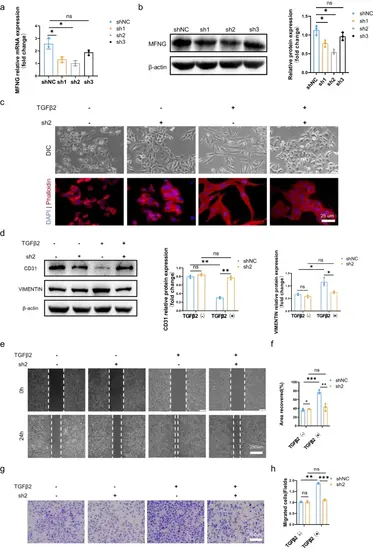
Attenuation of TGFβ2-induced EndMT in HUVECs by MFNG deprivation. a Verification of the knockdown efficiency of three MFNG-targeted shRNAs with different interference sequences at the transcriptional level. b Western blot confirmed successful MFNG knockdown in HUVECs, with corresponding quantitative analysis. β-actin served as the loading control. c Representative images illustrating the endothelial morphological phenotype of HUVECs transduced with MFNG shRNA lentivirus. The morphology of HUVECs infected with equal doses of sh-NC and sh-MFNG differed in response to TGFβ2. MFNG knockdown in HUVECs blocked the morphological changes induced by TGFβ2. Scale bars = 25 µm. d Western blot displayed alterations in EndMT markers, along with corresponding quantitative analysis. β-actin was used as an internal control. e–h MFNG deprivation hindered TGFβ2-induced HUVEC migration. e, f Representative images of cell wound healing assays and quantification of the scratch repair rate. Scale bars = 250 µm. g, h The transwell migration assay was performed, and the relative number of migrated cells per high-power field was measured. Scale bars = 100 µm. All data reported are from three independently repeated biological experiments |
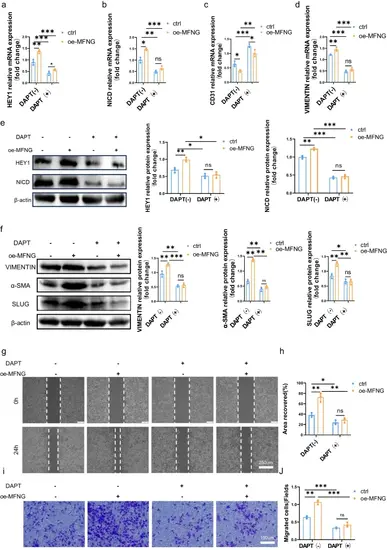
MFNG promoted EndMT by upregulating the activity of Notch signalling pathway. a–d Transcriptional analysis revealed that HUVECs overexpressing MFNG exhibited increased expression of Notch pathway molecules such as HEY1 and NICD, along with elevated levels of EndMT-associated genes, including VIMENTIN. Conversely, CD31 expression was restored following DAPT treatment. GAPDH was utilized as an internal reference for these evaluations. e, f Western blot analysis, represented by the accompanying blots and quantitative data, confirmed these findings at the protein level, illustrating alterations in EndMT markers and Notch pathway molecules. β-actin served as the loading control. g, i Cell migration capabilities were assessed through wound healing and transwell assays. h Quantitative analysis of wound area healing was conducted using ImageJ software. j The quantification of cell migration ability was performed by counting cells per field. All data presented are the result of three independently repeated biological experiments |
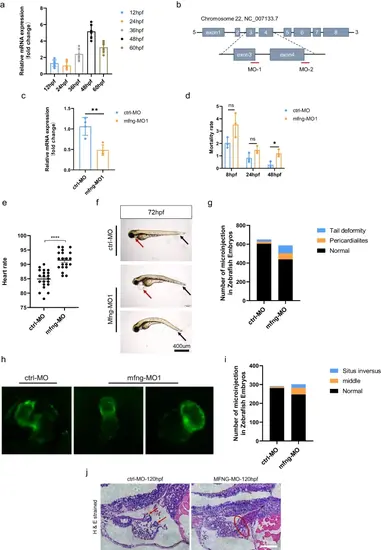
MFNG role in zebrafish is fundamental for heart and valve development. a qRT-PCR analysis of the relative transcript level of MFNG during embryogenesis from 24 to 60 hpf. Data are shown as the mean ± SEM, n = 6. b Schematic representation of MFNG exons with the target sites of MFNG MO-1 and MFNG MO-2, which induce MFNG deficiency in zebrafish embryos by targeting the 3-exon–3-intron junction and the 4-exon–4-intron junction, respectively. c The efficacy of MFNG MO1 was confirmed by qRT-PCR. Data are presented as mean ± SEM, n = 4. d The lethality of ctrl-MO and MFNG-MO embryos from 8 to 48 hpf. The chi-square test was used for statistical analysis. e The heart rate of ctrl-MO and MFNG-MO embryos at 72 hpf. f Bright-field views of live ctrl-MO and MFNG-MO embryos at 72 hpf. Note the pericardial edema (red arrowhead) and tail deformity (black arrowhead). g Compared to the ctrl-MO group, the MFNG-MO group exhibited a significantly higher number of pericardial edema and tail deformities. h, i Lateral views of ctrl-MO embryos and MFNG-MO embryos at 72 hpf, captured in the Tg (myl7: EGFP) background. Zebrafish embryos in the MFNG-MO group displayed absent regular heart looping. The chi-square test was used for statistical analysis. j Sections of zebrafish embryos stained with HE at 120 h post-MO injection. In the MFNG-MO group, the valve leaflets observed in the ctrl-MO group are absent. The red arrow represents the heart valve, and the red oval denotes the atrioventricular boundary PHENOTYPE:
|
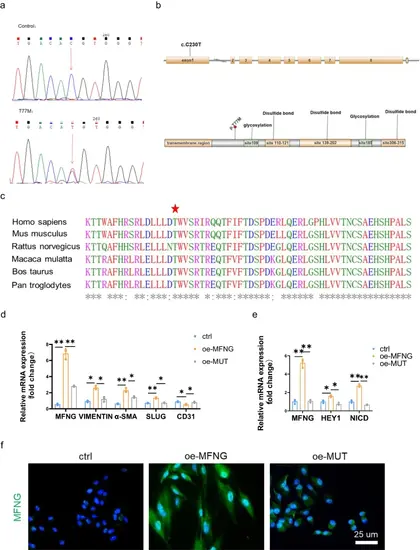
Validation and in silico analysis of the MFNG variant. a Sequences showing the MFNG missense variant, identified in both patients and healthy controls, with arrows indicating heterozygous nucleotide changes. b Depiction of the MFNG gene’s exon and protein structure, highlighting the location of the genetic variation within this study. Exon 1 of MFNG harbored the base substitutions. The amino acids were primarily composed of glycosylation and disulfide bond domains. c The MFNG mutation was found to exhibit a high degree of conservation across vertebrates, as evidenced by the Clustal X alignment of the MFNG protein in various species. Stars indicate identical residues. In our study, human umbilical vein endothelial cells (HUVECs) served as the control group. HUVECs transfected with the MFNG wild-type plasmid were designated as the overexpression group (oe-MFNG), while HUVECs transfected with the MFNG mutant plasmid were designated as the mutant group (oe-MUT). d, e The relative mRNA expression of MFNG, genes associated with EndMT, and molecules related to the Notch pathway in HUVECs subjected to various treatments was meticulously assessed, employing GAPDH as a reference gene. Significantly distinct mRNA expression levels of MFNG, EndMT-related genes, and Notch pathway molecules were evident when comparing the oe-MFNG and oe-MUT groups. f Cellular immunofluorescence staining underscored the diminished expression of MFNG in the oe-MUT groups compared to the oe-MFNG groups, as visualized through microscopic images. Scale bars = 25 µm |
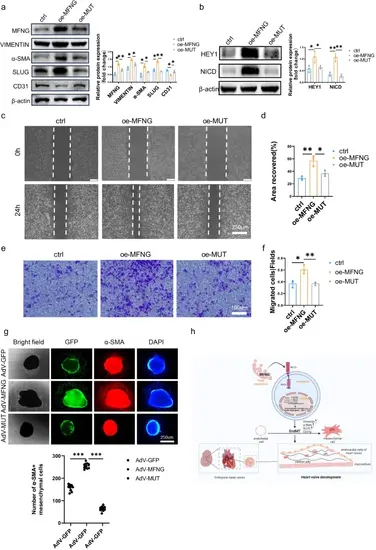
MFNG mutation blocked EndMT by inhibiting Notch pathway. a, b To delve deeper, we conducted an examination of the relative protein expression of MFNG, EndMT-related markers, and molecules associated with the Notch pathway in HUVECs subjected to various treatments, with Western blot analysis. The intensity of protein expression was quantified using ImageJ software, normalized to β-actin expression. Additionally, we conducted representative experiments, such as cell c wound healing assays and e transwell assays, which provided visual evidence that the MFNG variant had a restraining effect on the migration capacity of HUVECs. Quantitative statistics for cell wound d healing assays and f transwell assays (f) were also included. It is worth noting that all data presented here were derived from three independently repeated biological experiments. g Bright-field images demonstrate mesenchymal cell outgrowth from adenovirus-infected explants. GFP fluorescent images represent all cells infected with adenovirus. The mesenchymal cells migrating from endothelial cells were marked with the α-SMA antibody (red). The cell nuclei were stained with DAPI, which produces a blue signal. The quantitative analysis results demonstrate a significant reduction in the number of migrating mesenchymal cells in the presence of the MFNG mutation. High magnification results are shown in Fig. SI3. h A schematic model of the mechanisms of MFNG-mediated heart valve formation. MFNG exerts a positive regulatory influence on the EndMT process by enhancing the activity of the Notch signalling pathway, thereby promoting the heart valve development |