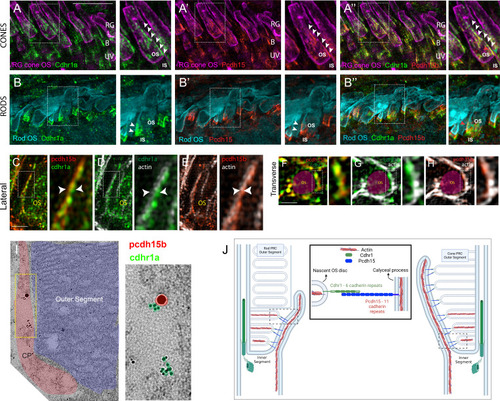
Evolutionarily conserved localization of pcdh15 and cdhr1 in photoreceptors predicts interactions linking outer segments and calyceal processes.
(A-A”) Confocal microscopy of wildtype 5 dpf retinal cryosections probed with cdhr1a antibody (green), Peanut germ agglutinin (PNA - magenta) to label red-green cones, and pcdh15b (red). White boxes indicate the location of the inset enlargement. White arrowheads highlight the linear localization of cdhr1a along cone OSs (A) and pcdh15b outlining the calyceal process (A’). Merge of all three signals highlights the proximity between cdhr1a and pcdh15b (A”). B=blue cones, RG = red/green cones, UV = UV cones. Scale bar = 5 μm. (B-B”) Confocal microscopy of wildtype 5 dpf retinal cryosections probed with cdhr1a antibody (green), pcdh15b (red), and wheat germ agglutinin (WGA -teal) to label rods. White boxes indicate the location of the inset enlargement. White arrowheads highlight the linear localization of cdhr1a along rod OSs (B) and pcdh15b outlining the calyceal process (B’). Merge of all three signals highlights the proximity between cdhr1a and pcdh15b (B”). Scale bar = 10 μm. (C–E) Structured illumination microscopy (SIM) of 5 dpf wildtype zebrafish retinal cryosections probed with (C) cdhr1a (green) and pcdh15b (red), (D) pcdh15b (red) and actin (white) and (E) pcdh15b (red) and actin (white). White boxes represent the inset enlargement. White arrowheads highlight the juxtaposition or overlap between the cdhr1a, pcdh15b, and actin signals. Scale bar = 2.5 μm. (F–H) Structured illumination microscopy (SIM) of wildtype zebrafish whole mount 5 dpf retina in transverse orientation (OS outlined in magenta) probed with (F) cdhr1a (green) and pcdh15b (red), (G) cdhr1a (green) and actin (white) and (H) pcdh15b (red) and actin (white). White boxes represent the inset enlargement. Scale bar = 2.5 μm. (I) Immuno-gold-TEM detection of cdhr1a (green) and pcdh15b (red) in 5 dpf wildtype retinal sections. The CP is outlined in red and the OS in blue. Scale bar = 500 nm (J) Diagrammatic model of the connection between the OS discs and CPs in both rod and cone cells mediated by the interaction between OS-bound cdhr1a and CP-bound pcdh15b.
|
