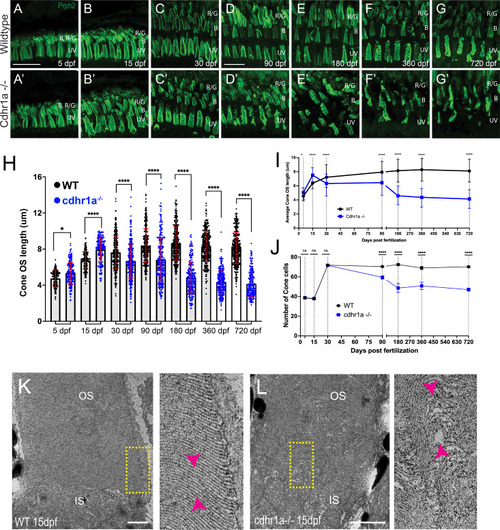
Loss of cdhr1a function leads to cone outer segment degeneration.
(A–G) Confocal microscopy of wildtype retinal cryosections probed with anti-prph2 antibody (green). B=blue cones, RG = red/green cones, UV = UV cones. Scale bar = 10 μm. (A’-G’) Confocal microscopy of cdhr1a-/- retinal cryosections probed with anti-prph2 antibody (green). A-B’ scale bar = 5 μm, C-G’ scale bar = 10 μm. (H) Quantification of cone OS length at 5, 15, 30, 90, 180, 360, and 720 dpf measured as length of prhp2 signal in wildtype (black dots) and cdhr1a-/- (blue dots). Standard deviation is shown in red. ****=p < 0.0001. ANOVA = p < 0.0001. (I) Line graph depicting the long-term trend of cone OS length changes between wildtype (black) and cdhr1a-/- (blue). (J) Line graph depicting changes in the number of cone cells counted in the observation region over time in wildtype (black) compared to cdhr1a (blue). (K) Transmission electron microscopy micrographs from a 15 dpf wildtype retina. The yellow rectangle represents the enlarged inset. Magenta arrowheads highlight the proper stacking of OS discs. IS = inner segment, OS = outer segment. Scale bar = 500 nm. (L) Transmission electron microscopy micrographs from a 15 dpf cdhr1a-/- retina. The yellow rectangle represents the enlarged inset. Magenta arrowheads highlight the improper and distorted stacking of OS discs. IS = inner segment, OS = outer segment. Scale bar = 500 nm.
|
