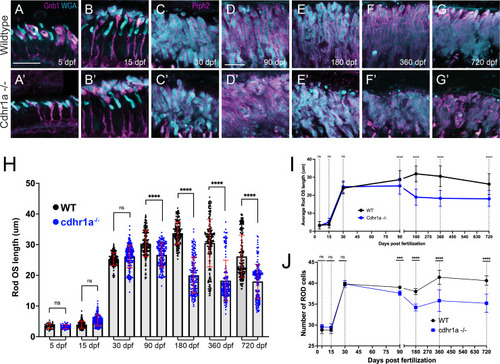
Loss of cdhr1a function leads to late-onset rod outer segment degeneration.
(A–B) Confocal microscopy of wildtype retinal cryosections probed with Gnb1 antibody (magenta) and WGA (teal) to identify rod outer segments at 5 and 15 dpf. Scale bar = 10 μm. (A’-B’) Confocal microscopy of cdhr1a-/- retinal cryosections probed with Gnb1 antibody (magenta) and WGA (teal) to identify rod outer segments at 5 and 15 dpf. Scale bar = 10 μm. (C–G) Confocal microscopy of wildtype retinal cryosections probed with prph2 antibody (magenta) and WGA (teal) to identify rod outer segments. A-B’ scale bar = 5 μm, C-G’ scale bar = 10 μm. (C’-G’) Confocal microscopy of cdhr1a-/- retinal cryosections probed with prph2 antibody (magenta) and WGA (teal) to identify rod outer segments. Scale bar = 10 μm. (H) Quantification of rod OS length at 5, 15, 30, 90, 180, 360, and 720 dpf measured as length of WGA signal in wildtype (black dots) and cdhr1a-/- (blue dots). Standard deviation is shown in red. **=p < 0.001, ****=p < 0.0001. ANOVA = p < 0.0001. (I) Line graph depicting the long-term trend of rod OS length changes between wildtype (black) and cdhr1a-/- (blue). (J) Line graph depicting changes in the number of rod cells counted in the observation region over time in wildtype (black) compared to cdhr1a-/- (blue).
|
