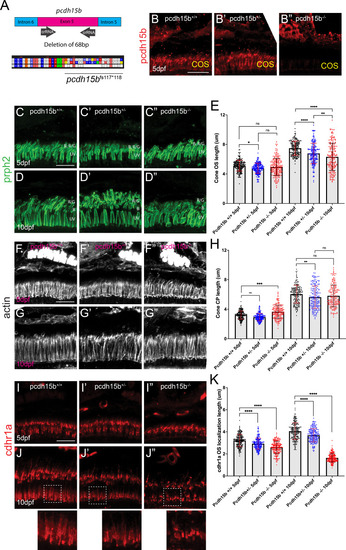
Loss of pcdh15b function leads to early cone OS defects and mis-localization of cdhr1a.
(A) Diagrammatic representation of the CRISPR/Cas9 strategy for generating a pcdh15b loss-of-function allele. crRNAs were targeted to the flanking sequences of exon 5 and resulted in a heritable deletion of 68 bp which resulted in a frameshift (fs) at AA117 and a premature stop codon (*) at AA118. (B-B”) Confocal microscopy of retinal cryosections from wildtype, pcdh15b+/-, and pcdh15b-/- individuals probed with pcdh15b antibody (red). Scale bar = 10 μm.(C-D”) Confocal microscopy of retinal cryosections from wildtype, pcdh15b+/-, and pcdh15b-/- individuals probed with prhp2 antibody (green) to visualize the cone outer segments (COS) at 5 dpf (C-C”) and 10 dpf (D-D”). B=blue cones, RG = red/green cones, UV = UV cones. Scale bar = 10 μm. (E) Quantification of COS length using prph2 signal for each genotype at each time point is depicted on the right. Standard deviation is shown in red. ns = not significant, **=p < 0.01. ****=p > 0.0001. ANOVA = p < 0.0001. (F-G”) Confocal microscopy of retinal cryosections from wildtype, pcdh15b+/-, and pcdh15b-/- individuals probed with actin antibody (white) to visualize cone CPs at 5 dpf (F-F”) and 10 dpf (G-G”). Scale bar = 10 μm. (H) Quantification of CP length using actin signal for each genotype at each time point is depicted on the right. Standard deviation is shown in red. ns = not significant, **=p < 0.01. ****=p > 0.0001. ANOVA = p < 0.0001. (I-J”) Confocal microscopy of retinal cryosections from wildtype, pcdh15b+/-, and pcdh15b-/- individuals probed with cdhr1a antibody (red) at 5 dpf (I-I”) and 10 dpf (J-J”). White boxes indicate regions enlarged. Scale bar = 10 μm. (K) Quantification of cdhr1a OS length for each genotype at each time point is depicted on the right. Standard deviation is shown in red. ns = not significant, ***=p < 0.001. ****=p > 0.0001. ANOVA = p < 0.0001.
|
