|
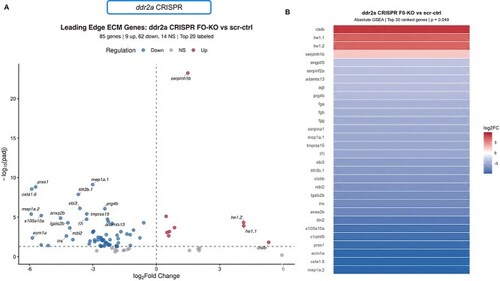
Differential expression of leading-edge extracellular matrix (ECM) genes in 4 dpf ddr2a CRISPR-F0 zebrafish larvae (zfl) heads compared with scrambled controls (scr-ctrl). (A) volcano plot showing log2 fold change versus –log10 adjusted p-value for ECM-related leading-edge genes identified by absolute gene-set enrichment analysis (GSEA). Each dot represents one gene. The dashed vertical line marks no change in expression, and the horizontal dashed line indicates the significance cutoff (padj < 0.05). In total, 62 of 71 significantly dysregulated genes were down-regulated in ddr2a F0-KOs, 9 were up-regulated. (B) Heatmap of log2 fold changes for the top 30 leading-edge genes identified by absolute GSEA in the comparison of ddr2a F0-KO versus scrambled control (P = 0.049). Gene expression changes were derived from DESeq2 differential expression analysis. Colors indicate the direction and magnitude of the expression.
|