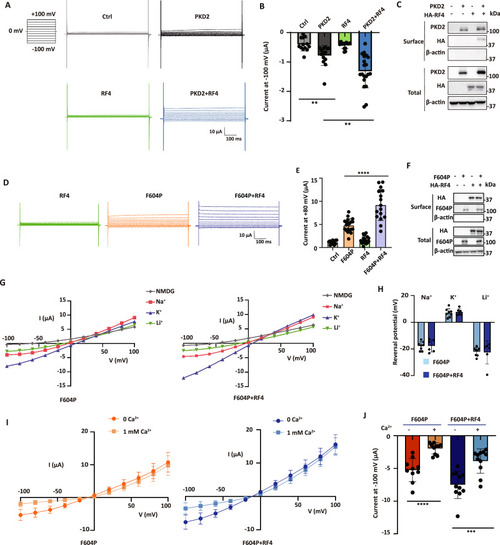
Effect of RASSF4 on PKD2 channel function in Xenopus oocytes.
A Oocytes were co-injected with antisense thiophosphate oligonucleotides targeting connexin 38 (aCnx38) to minimize the endogenous currents induced in the presence of divalent cation-free extracellular solutions, similarly as described64. TEVC experiments were carried out in the extracellular Na+-containing divalent cation-free solution (in mM: 100 NaCl, 2 KCl, 10 Hepes, pH 7.5). A voltage-jump protocol (left panel) was used to generate representative current traces (right panels) obtained in oocytes overexpressing RASSF4, PKD2, PKD2 + RASSF4 or none (Ctrl). B Averaged steady-state currents at −100 mV under the same experimental conditions as in (A). Data are presented as the mean ± SD, n = 13–20 oocytes for each condition. **p < 0.01, by unpaired Student’s t test. Exact p values: Ctrl vs. PKD2, p = 0.0024; PKD2 vs PKD2 + RF4, p = 0.0035. C Representative biotinylation data showing the biotinylated (surface) and total protein expression of PKD2 and RASSF4. D Representative current traces showing the effect of RASSF4 on the function of PKD2 mutant F604P, under similar experimental conditions as in (A), except that 0.3 mM MgCl₂ was added to the extracellular solution and that oocytes were not injected with aCnx38. n = 15–20 oocytes for each condition. E Averaged steady-state currents at +80 mV under the same experimental conditions as in (D). Data are presented as the mean ± SD, with n = 15–20 oocytes. ****p < 0.0001, by unpaired Student’s t test. F Representative biotinylation data showing the biotinylated (surface) and total expression of PKD2-F604P and RASSF4. G Effect of RASSF4 on the cation selectivity of mutant F604P. Averaged I–V curves were obtained in the presence of different monovalent cations, as indicated, under the same experimental conditions as in (A) (n = 8 and 6 oocytes for F604P and F604P + RASSF4, respectively) and have been subtracted by the averaged I–V curves from control oocytes (n = 7). The Na+-containing solution was replaced by equimolar K+, Li+, or NMDG. Data are presented as the mean ± SD. H Averaged reversal potentials obtained from data in (G). Data are presented as the mean ± SD, with n = 6–8 oocytes. Averaged I–V curves (I) and currents at −100 mV (J) obtained under similar conditions as in (G) with or without 1 mM Ca2+ (n = 10 and 11 oocytes for F604P and F604P + RASSF4, respectively), with subtraction by averaged currents obtained from control oocytes (n = 10). Data are presented as the mean ± SD. ****p < 0.0001 and ***p < 0.001, by paired Student’s t test for the effect of Ca2+. Exact p value: F604P + RF4, with Ca2+ vs no Ca2+, p = 0.0004.
|
