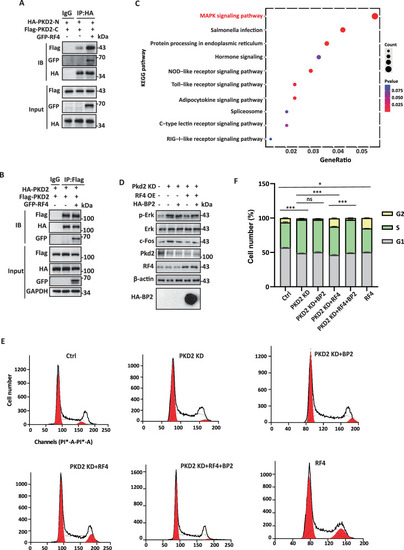
Effects of RASSF4 or BP2 on the PKD2 N/C binding, RAS/MAPK signaling pathway activity, and cell cycle progression.
A Representative co-IP data using HEK cells, showing the effect of RASSF4 OE on the intramolecular N/C binding assessed by co-IP strength between PKD2-N (M1-S219) and PKD2-C (I671-V968). B Representative co-IP data using HEK cells, showing the effect of RASSF4 on the PKD2 intermolecular binding assessed by co-IP strength between HA-PKD2 and Flag-PKD2. C KEGG pathway enrichment (transcriptome) analysis (by means of RNA-seq assays and the Hypergeometric test) in 5-dpf zebrafish was performed for calculating the ratio of the number of significantly upregulated genes under the PKD2 KD to that under the WT PKD2 condition. The dot size indicates the number of upregulated genes (count), and the dot color represents the p-value to indicate the significance of the enrichment. Fifty zebrafish larvae were collected for each assay condition, and shown result was averaged from three independent experiments. D Representative WB data showing the effect of HA-BP2 OE on the ERK and p-ERK levels in 5-dpf zebrafish larvae with PKD2 KD and RASSF4 OE. E Representative cell cycle data obtained using transfected MDCK cells with PKD2 KD by shRNA, HA-RASSF4 OE, or HA-BP2 OE. Cells at 80% confluency were used for transient transfections, and 36 h after were harvested for propidium iodide (PI) staining and flow cytometry analysis. PI fluorescence intensity, which reflects the DNA content, was detected using flow cytometry. The number of detected cells (y-axis) was plotted as a function of the number of PI fluorescence intensity (x-axis) under different conditions, as indicated. F Statistical data obtained as in (E), showing cell cycle distribution averaged from three independent experiments, presented as the mean ± SD. ***p < 0.001, and ***p < 0.001, ns, not significant, by one-way ANOVA analysis.
|
